


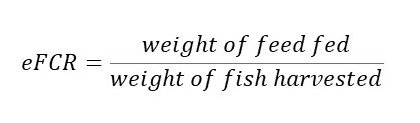
eFCR calculation
The data presented below, is based on industry-wide feed conversion rates (FCR), and regional proportional fed volumes estimates based on expert opinion.
|
Species Group |
2000 |
2010 |
2020 |
|
Crustaceans |
1.08 |
0.93 |
0.92 |
|
• Shrimp*
|
1.19 |
1.07 |
1.43 |
|
Marine Fin Fish |
1.18 |
1.05 |
0.86 |
|
Salmonids |
1.54 |
1.52 |
1.27 |
|
• Atlantic salmon
|
1.36 |
1.30 |
1.27 |
|
Eels |
1.65 |
0.96 |
0.81 |
|
Cyprinids |
0.40 |
0.33 |
0.30 |
|
Tilapias and other cichlids |
1.46 |
1.46 |
1.35 |
|
Freshwater Fish |
1.12 |
1.08 |
0.96 |
|
Turtles and Frogs |
2.40 |
2.13 |
1.19 |
|
Total Fed Aquaculture |
0.75 |
0.76 |
0.71 |
Original data derived from FAO FishStat and IFFO2023.
*Includes both white shrimp (Litopenaeus vannamei) and tiger shrimp (Penaeus monodon) production.
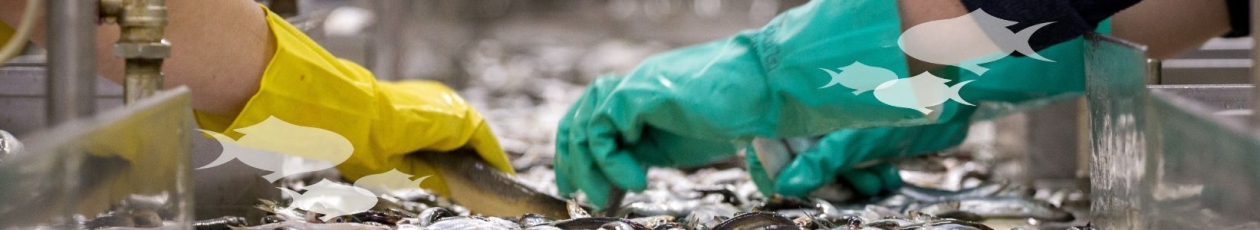
For eFCR, an improving trend is noted across all sectors between year 2000 and 2020. Key improvement drivers over the period include gains in nutritional knowledge of major species, allowing feeds to tailored to species needs more precisely to deliver nutrients more efficiently. There have also been significant improvements in feed management strategies and technologies resulting in improved feed intakes and ensuring less feed is lost, both which also contribute to improving efficiencies. Notably, many sectors show eFCR values less than 1.0 : 1 reflecting not only the high efficiency of aquaculture production, but also that in many such production systems the use of feed is supplemented by natural system productivity. The eFCR values by their nature reflecting this relationship between the feed fed and product harvested, irrespective of where the overall nutrition is derived from. Overall, total global fed aquaculture has an eFCR of 0.732 steadily improving from 0.81 in 2000.
Full species list under each category is available here.