
eFIFO calculations
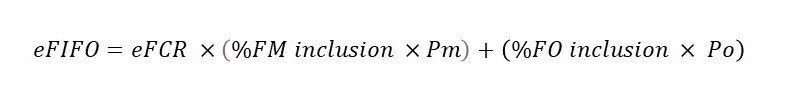
•%FM inclusion = the proportion of the diet as fishmeal,
•%FO inclusion = the proportion of the diet as fish oil,
•Pm = the economic embodiment of fishmeal
• Po = the economic embodiment of fish oil.
The Po value is based on the same calculation as the PM value, but with the EVo replacing the EVm as the numerator. The economic embodiment value is derived using the proportional value of the different co-products.
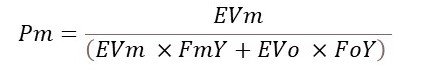
•EVm = the economic value of fishmeal (cost per metric tonnes)
•EVo = the economic value of fish oil (cost per metric tonnes)
•FmY = the embodiment of fishmeal (usually 22.5%)
•FoY = the embodiment of fish oil (usually 5%).
|
Species Group |
2000 |
2010 |
2020 |
|
Crustaceans |
1.39 |
0.56 |
0.43 |
|
• Shrimp
|
1.25 |
0.71 |
0.84 |
|
Marine Fin Fish |
1.76 |
0.95 |
0.74 |
|
Salmonids |
2.52 |
1.84 |
1.00 |
|
• Atlantic salmon
|
2.81 |
1.84 |
1.02 |
|
Eels |
4.15 |
1.72 |
1.30 |
|
Cyprinids |
0.09 |
0.02 |
0.01 |
|
Tilapias and other cichlids |
0.65 |
0.28 |
0.11 |
|
Freshwater Fish |
0.66 |
0.36 |
0.26 |
|
Turtles and Frogs |
3.89 |
2.79 |
1.50 |
|
Total Fed Aquaculture |
0.64 |
0.37 |
0.27 |
|
Fishmeal price (USD$/t)# |
$450 |
$1,260 |
$1,580 |
|
Fish oil price (USD$/t) # |
$200 |
$1,080 |
$1,895 |
|
Whole fish origin |
80% |
75% |
70% |
|
By-product origin |
20% |
25% |
30% |
Original data derived from FAO FishStat and IFFO2022. aIncludes both white shrimp (Litopenaeus vannamei) and tiger shrimp (Penaeus monodon) production. bAnnualized prices weighted across grades f.o.b. Lima, Peru.
In general there is a continued reduction in the FIFO figures, reflecting the use of fishmeal and fish oil as strategic ingredients at key points in aquaculture production cycles with a trend towards optimising their nutritional contributions. The overall fed aquaculture figure shows a marked decrease to 0.19, essentially meaning that for every 0.19kg of whole wild fish used in fishmeal production, a kilo of farmed fish is produced. In other words, for every 1 kg of wild fish used 5 kg of farmed fish is produced. There has been a reduction across all categories, but of particular note is the figure for salmonids, which for 2020 is seen to be below 1.0, i.e. the salmonid feed industry supports the production of more farmed fish than it uses as feed fish. On the whole this is a very positive message about the contribution that marine ingredients make to global protein production. The marine ingredients industry supports the production of a significantly greater volume of protein for humanity than would be supplied merely through the direct consumption of the fish used as raw material in the production process.
Full species list under each category is available here.