

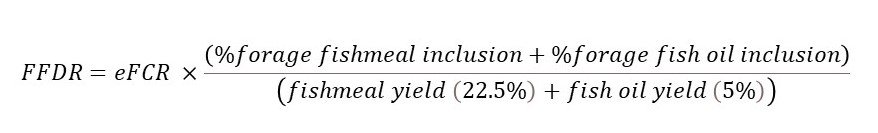
FFDR calculation
|
Species Group |
2000 |
2010 |
2020 |
|
Crustaceans |
1.06 |
0.42 |
0.30 |
|
• Shrimp
|
0.94 |
0.53 |
0.60 |
|
Marine Fin Fish |
1.40 |
0.71 |
0.53 |
|
Salmonids |
2.43 |
1.43 |
0.67 |
|
• Atlantic salmon
|
2.57 |
1.42 |
0.68 |
|
Eels |
3.11 |
1.27 |
0.94 |
|
Cyprinids |
0.07 |
0.01 |
0.01 |
|
Tilapias and other cichlids |
0.50 |
0.21 |
0.08 |
|
Freshwater Fish |
0.49 |
0.27 |
0.19 |
|
Turtles and Frogs |
2.81 |
2.04 |
1.09 |
|
Total Fed Aquaculture |
0.52 |
0.28 |
0.19 |
Original data derived from FAO FishStat and IFFO2023. aIncludes both white shrimp (Litopenaeus vannamei) and tiger shrimp (Penaeus monodon) production.
Full species list under each category is available here.
The forage fish dependency ratio (FFDR) values have also seen notable improvements between 2000 and 2020. In 2020, all values for each of the different species’ groups are below 1.0. Major improvements in FFDR values for sectors like the salmonids and crustaceans are noted, with four-fold reductions achieved in those sectors over the past twenty years. Overall, global FFDR values across all fed aquaculture show that only 0.13 kg of forage fish is used for each kilogram of fed aquaculture production. There are various reasons underpinning these improvements. The nature of the FFDR calculation leverages of both the eFCR values and the marine ingredient inclusion values. Accordingly, improvements in eFCR also impact the FFDR and this is noted from the changes in eFCR over time. However, reductions in the inclusion of forage fish sourced marine ingredients through both changes in total marine ingredient use and the relative use of forage fish versus by-product sourced marine ingredients, have also been influential.