

IFFO held an InFocus Webinar on life cycle assessment for aquafeed ingredients, exploring the latest data with the GFLI's Delanie Kellon, Executive Director of the Global Feed Lifecycle Assessment Institute (GFLI) and Brett Glencross, Technical Director at IFFO on 8th October. Delanie Kellon started by setting the scene on GFLI’s role, providing a globally accessible, evolving animal feed ingredient Life Cycle Assessment (LCA) database and supporting compliant, credible, and transparent environmental assessment of animal feed ingredients. GFLI has continued to evolve with international guidance and works with member companies to drive improvement.
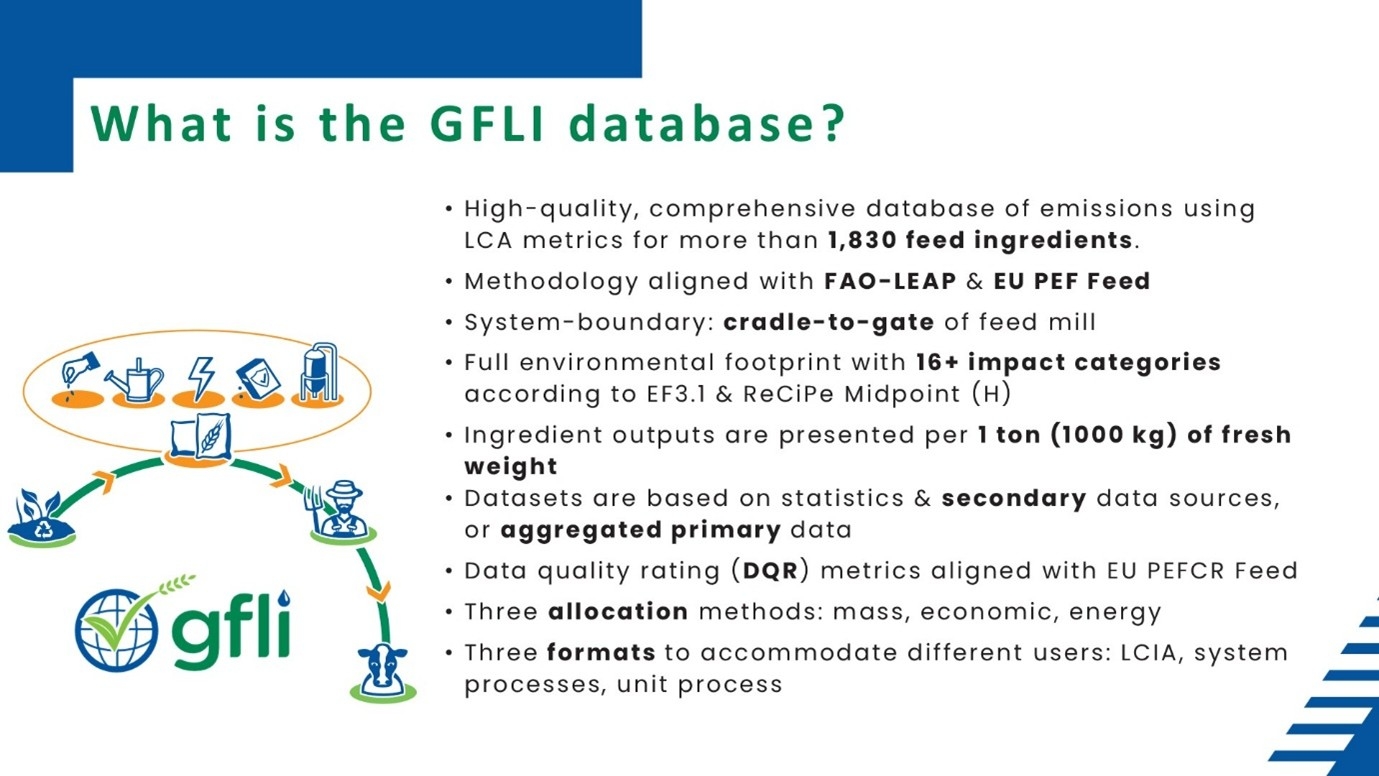
The GFLI database includes LCA metrics for more than 1,830 feed ingredients with methodology aligned with FAO’s LEAP (Livestock Environmental Assessment and Performance) & EU’s PEFCR (Product Environmental Footprint Category Rules) for Feed guidelines. As part of that the GFLI works on a system boundary of cradle-to-gate of feed ingredient production (feed mill). The full environmental footprint has16+ impact categories, with datasets based on various statistics and secondary data sources, or aggregated primary data. There are three allocation methods used (mass, economic, and energy) and three different formats to allow users to access the data in multiple ways with feed formulations, benchmarks or sustainability reporting.
Driving improvement through the value chain
Starting with global guidance and compliance, the FAO LEAP provides global guidance, whereas EU’s PEF has implemented rules that ‘shall be complied’ with and GFLI has ensured that those are met. There are plans to further align the database with others such as Feedipedia, with continuous work to adapt core datasets to specific needs, while ensuring that the data is standardized and understandable. By connecting GFLI data with EU’s PEFCR, GFLI can be a catalyst for improvement, driving innovation throughout the value chain, with more efficient data collection and data usage.
What data can companies access?
Companies can access a high-quality database of secondary data, and the database is accessible via the purchase of a license agreement. There is also ‘Branded Data’ methodology, which has been developed to respond to the growing demand for primary data and many companies’ have shown interest in showcasing their own environmental footprint, which is also being sought by the feed sector.
Growth of data
GFLI’s data is getting more regional and more precise, with new methodologies and a SBTi (Science-based target)-FLAG (Forest, Land and Agriculture) compliant version of the GFLI database for corporate targets to reduce emissions. GFLI is also involved in the OECD's development of a framework for measuring carbon footprints of Agri-Food Products. With IFFO there is also the inclusion and update of marine ingredient data based on new primary data derived values. There will also be the publication of Marine data generator tool, which will automate data modelling for PEF (Marine Fish PEFCR) and GFLI-compliant marine-based data creation.
Role for sector base data vs branded datasets
Sectoral datasets are extremely relevant and often regionalised. They are critically important for the supply chain as primary data is often hard to get. Branded data is harder to gather, but has clear benefits for data providers and users. Industry bodies, associations or company groupings do benefit from driving data collection, filling in missing data gaps to ensure their sector is correctly represented.
Marine ingredients: You can only manage what you measure
Glencross provided an overview of IFFO’s work on data collection, noting that “we need to move toward a more transparent assessment process as this will better support aquaculture to move forward by being able to assess the sustainability of the use of all feed ingredient resources on an equivalent basis.” Adding that “LCA is the best option that we’ve got, allowing us to look at the production process in a more systematic way, aligning with SDGs.”
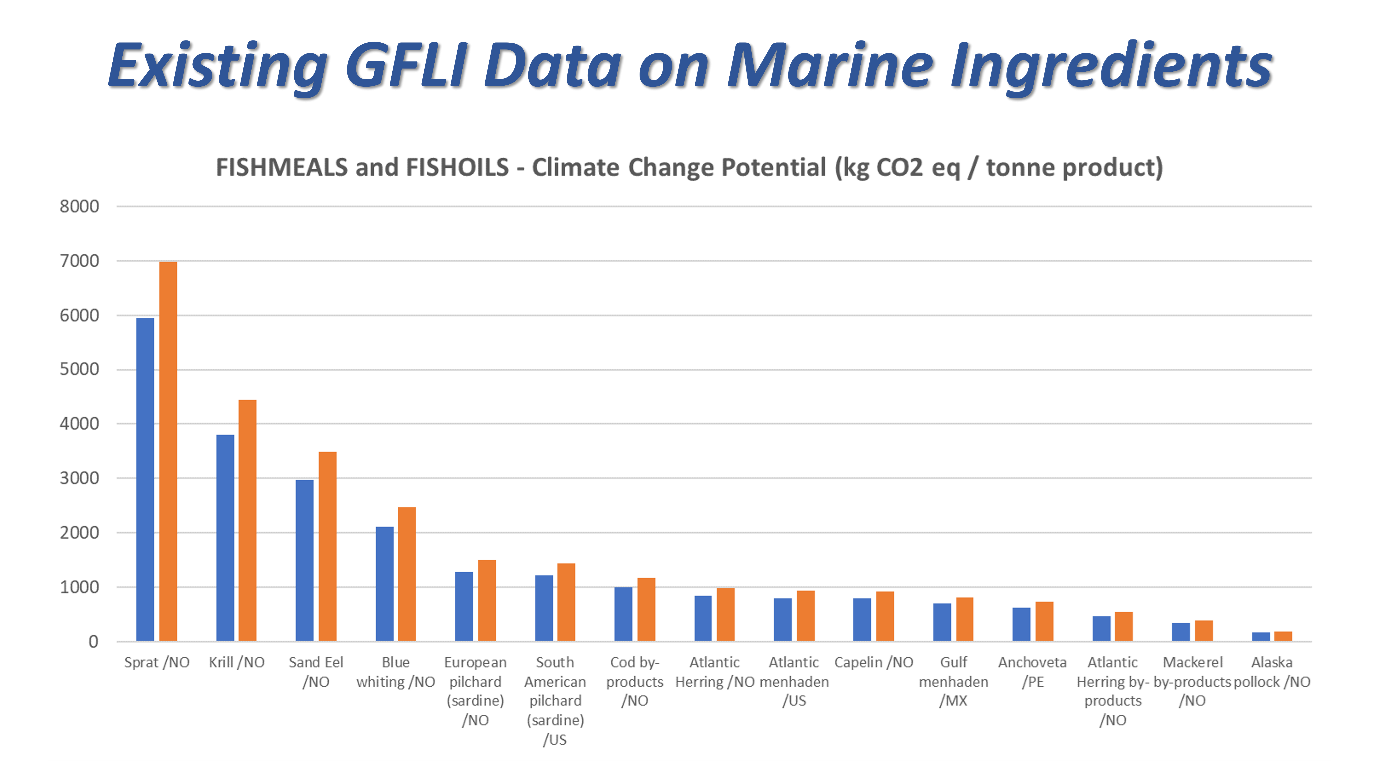
Everything has a footprint somewhere and marine ingredients perform well mostly across the dataset. In feed formulations, LCA data can be used to calculate carbon footprint, often reducing agricultural ingredients. Primary data from ingredient suppliers is increasingly being sought by the feed producers as values can vary markedly. Delving into meals and oils there is a very broad range of data including most major sources of marine ingredients, but primary data is limited. Most feed companies are now using LCA data and have carbon footprint targets to meet.
How to map and track impacts: Cradle to Gate
Environmental impacts do not just occur on the production unit, they need to be tracked from raw material extraction (capture), processing, distribution, consumption/use, and waste disposal. Defining the extent (boundaries) of a system is critical, and IFFO has focused on a CRADLE-to-GATE (when it leaves ownership of producers) analysis of Marine Ingredient Production. Glencross noted that IFFO has mapped six different system boundaries and flows, due to the range of production flows, such as direct human consumption processing and then the use of the remaining by-products, which can involve secondary transfers for rendering. The challenge was to standardize the data in these different systems to 1 tonne of fish to ensure the data is usable.
IFFO’s data collection
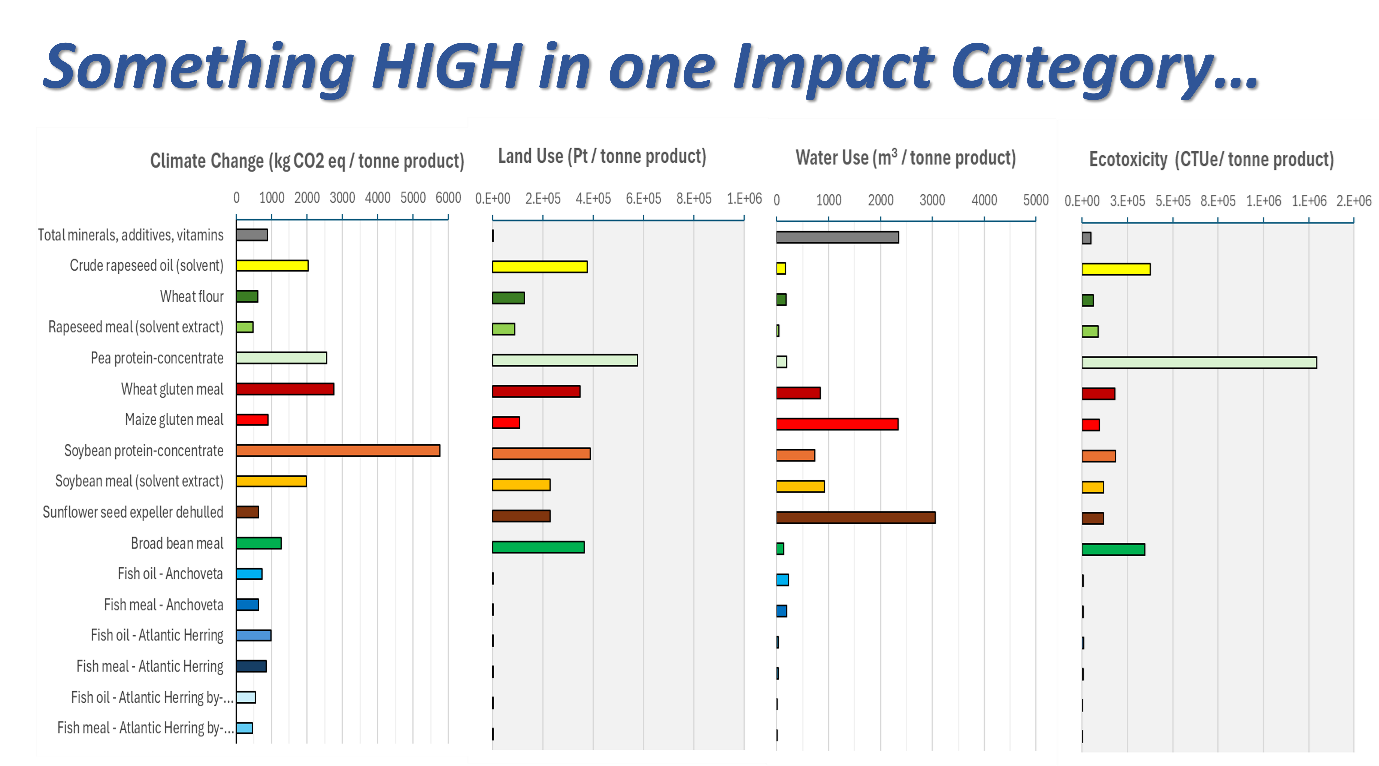
IFFO has created a primary data collection excel template for companies to then use, covering key data elements across three systems: processing, rendering, external storage, and transportation between them. This data is then fed into Simapro, the LCA standard software which allows you to then map and access the data. Simapro allows companies to map not just carbon foodprint, but also land use, ozone depletion, water use or even ecotoxicity, helping broaden the discussion on various ingredients. Interesting takeaways include that the higher oil yields tend to have lower carbon footprints, and the differing impacts of fishing methods, with purse seine fishing methods having a lower carbon footprint.
So far IFFO has collected 53 different product data sets across the global industry, comprising of 13 different types of fishmeals and fish oils. Reports detailing the footprint of each product have already been delivered to all participants who have provided data. IFFO’s currently working with GFLI to progress the audit stage to update the Database in 2026. Glencross ended by saying there is still more work to do: “We always need more data!”