
Read the piece published by Dr Brett Glencross in International Aquafeed (March 2025)
Download the full piece here or look at the International Aquafeed Magazine's website.
The sustainability of marine ingredients in aquaculture feeds has been a focus of various measures (metrics), each coming with its own range of assumptions. These metrics are critical for assessing the role of marine ingredients, yet their limitations are significant. In a recently published review, the background behind each of these metrics, aspects of their origins, and each of their shortcomings are examined. For details on how each metric evolved, their calculation we suggest readers refer to that paper, rather than we reiterate it here. A key failing however of each of these metrics was noted in that none of them allowed for the assessment of “trade-offs” and the consequences thereof; that is the passing of risk from one resource to another. They all focussed on marine ingredients without recognising that replacing these ingredients with an alternative does not necessarily improve sustainability, reduce risk, or even change the global impact on fisheries. As such, the history of marine ingredient sustainability assessment, and indeed the point of this article, is to provide an overview of the merits in moving towards holistic assessments of ALL aquaculture feed ingredients.
Some of the commonly used metrics applied to marine ingredients include the fish-in:fish-out ratio (FIFO), forage fish dependency ratio (FFDR), and more recently the economic fish-in:fish-out ratio (eFIFO). While it is recognised that each of these metrics is a progression from the former, they are all myopic in that they focus only on marine ingredients. Notably, few other ingredients, or indeed even other feed sectors use similar such metrics in assessing their sustainability. Interestingly, we see now in the 2020s with the introduction of initiatives such as the European Union Deforestation Regulations (EUDR), that society is increasingly recognising the risks of such trade-offs and establishing systems to ensure the use of potential alternatives doesn’t take us from the “frying-pan and into the fire”. However, the object of this article is not to avert attention on the issues of sustainability, but rather to highlight its importance, and propose an alternative strategy to assess the sustainability of ALL ingredients based on a life cycle assessment (LCA) approach. By promoting such a shift in feed sustainability thinking, we believe this will fundamentally assist a move towards a more transparent assessment process which will better support aquaculture to move forward by being able to assess the sustainability of the use of all feed ingredient resources on a shared assessment framework.
One criticism of marine ingredients has been their reliance on wild fisheries. However, in recent years there has been a marked shift in resource use in the sector, with increasingly the by-products from fishery and aquaculture production for human consumption constituting the raw material basis to produce fishmeal and fish oil (Figure 1). While there remain many fisheries around the world coming under increasingly unsustainable pressure (FAO 2022), particularly in the developing world, the science clearly shows that when effective fisheries management practices are implemented, then there is clear capacity to rebuild many of the fish stocks whilst continuing to exploit them (Hilborn et al., 2020). Notably, the scientific evidence clearly demonstrates this for many forage fisheries (Hilborn et al. 2022). Indeed, many of the small pelagic fisheries demonstrate this with their management in many cases being an exemplar of world’s best practice (Hilborn et al. 2022). As such, stock sustainability, which in well managed fisheries also includes broader system demands for the resource, also includes the needs of the predators of the forage fish in each specific food-chain (Free et al., 2021).
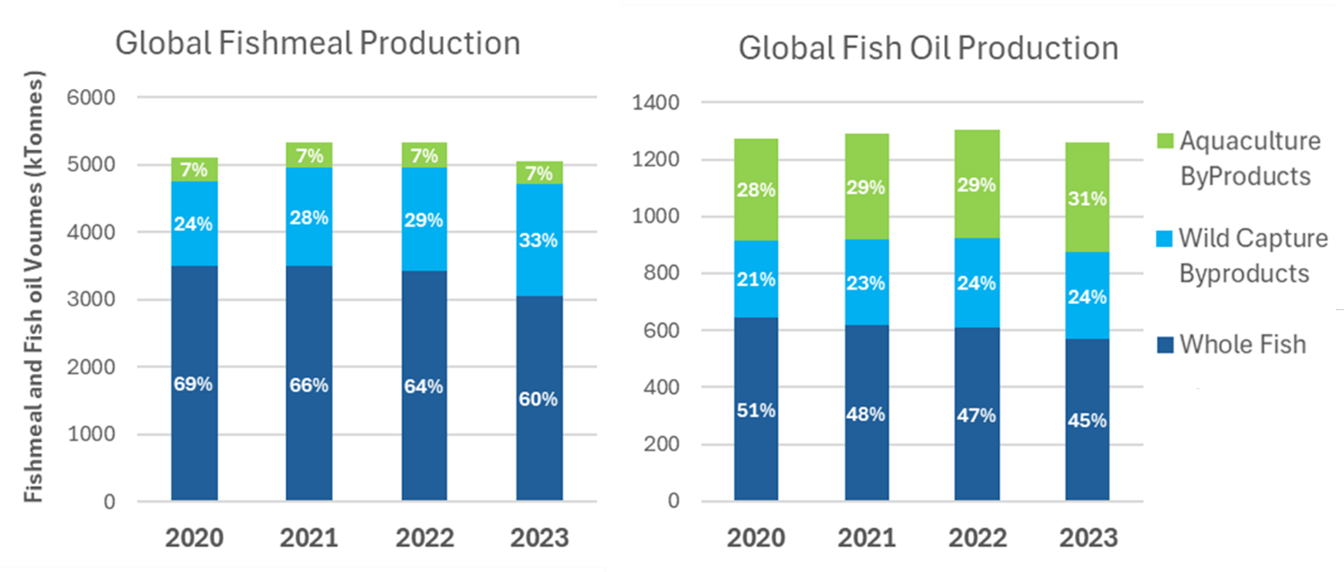
Figure 1. Raw material origins of global fishmeal and fish oil production from 2020 to 2023. Data from IFFO 2024.
Changing Values Lead to Changing Markets
Because marine ingredient production over the past thirty years has not grown, when confronted with the burgeoning demand from aquaculture, this has meant that the economic values of marine ingredients have risen substantially over time. Such growth in the value of the marine ingredient sector, in the absence of volume growth, has meant that there have been marked changes in the use of the products has also occurred over time. As with most supply-demand constraints, increasingly the resources move towards those markets with the greater purchasing power, which has led to the transition of using marine ingredients in feeds for poultry and pigs to that of aquaculture, and more recently to pet and direct human food (Glencross et al., 2024a). It has been clear that this has been a good move, as it means that those limited resources are being used more efficiently and maintain more of their nutritional value directly into our food chain. All feeds (livestock and aquaculture) have only been able to be produced at current quantities though, due to the increased use of vegetable proteins, but the macro- and micronutrient density in marine ingredients still make them an important inclusion in certain feed types, albeit presently at a much lower percent inclusion than was the case twenty years ago (Naylor et al., 2000; 2021).
The history of the use of fish oil tells a slightly different story to that of fishmeal. Over time, its value has grown to exceed that of fishmeal as it is increasingly being sought for direct human consumption (DHC), either as a nutraceutical omega-3 supplement or as a cooking oil. Although most of the fish oil is used by aquaculture, the growth in value is driven by the DHC and petfood markets, both of whom pay premium prices for the higher quality resources. The key driver here has been the discovery of the nutritional value to humans of the long-chain omega-3 fatty acids (Calder 2015). Their benefits in terms of human health have been widely extolled for several decades now and the omega-3 nutraceutical market has grown to become a major economic driver of fish oil consumption globally.
You Cannot Manage What You Cannot Measure
The recognition of the finite nature of global fisheries resources and the constraints to the use of marine ingredients as feed resources were well recognised early in the 1990s. Observations by various sectors had suggested that the supply of fishmeal was going to constrain the development of aquaculture as an industry and various research programmes across the world were implemented to address this looming constraint (Boyd et al. 2020; Glencross et al. 2023). Evolution of this concern, it appears, gave rise to the notion that use of fisheries and from them the fishmeal and/or marine ingredients was unsustainable, despite that no specific metrics to evidence the case have ever demonstrated that this has been the case.
Over the past 30 years, a range of sustainability metrics have arisen, that calculate the use of marine ingredient content in animal feed, and most notably that of aquaculture feed (Naylor et al. 2000; 2021; Tacon and Metian 2009; Jackson 2009; Kaushik and Troell 2010; Kok et al. 2020). The most commonly metrics include FIFO, FFDR and eFIFO, which in many respects are each simply evolutions of the former. There are many issues with those metrics, notably that they count all marine ingredients as equal. Though clearly well managed fisheries are not equivalent to poorly managed, or over-fished ones. Additionally, they focus only on the use of marine ingredients, and do not consider the impact of what may replace them in feeds. Clearly, a more holistic approach is needed to establish more relevant goals and enable the measurement of progress against them. Goals that can better demonstrate impact, effectiveness, and the consequences of making trade-offs across ingredients.
No sector functions in isolation
Originally the FIFO was a metric that was developed to examine the “efficiency” of fish use in animal production. Nearly all the focus has been on aquaculture in isolation relative to the use of wild fish in feed to produce farmed fish. This is despite that over the past sixty years more fishmeal overall has been fed to pigs and poultry than aquaculture. The FIFO aims to assess the balance in perceived fish production in terms of nutrition available for direct human consumption. Conversely, a similar concept seems to have never been used in other animal production sectors that also use food grade materials to grow food animals (e.g., corn used to feed pigs and chickens). Indeed, the 2022 global grain use statistics [Figure 2] show that over 40% of global grain (cereals and oilseeds) production is fed to an animal, with close to 1.5 billion tonnes of grain each year being fed to cattle, pigs, chickens and fish. If we compare the number for global fish resource sue, we can see that less than 10% of global fish use is as feed. So there seems something of an imbalance in this assessment from an overall food production system impacts perspective.
An important consideration of fishmeal and fish oil production is that the process operates from the same raw material base and each ingredient is a co-product of that process. One cannot be produced without the other and as such examination of dependency ratios of one ingredient independent of the other are illogical. The actual yields of fishmeal and fish oil though differ depending on the fish species being processed, but globally the weighted average yield in 2020 was around 225kg fishmeal and 48kg fish oil per tonne of harvested fish raw material (Glencross et al., 2024a). While fishmeal yields are quite consistent around that number of 225 kg, fish oil yields can range from <10kg to >180kg. This can also vary year to year depending on the oil yield of different fish species, which occurs due to changes in environmental conditions, and the size/maturity of the fish at harvest. Notably, over time those yield values have become more efficient, reflecting improved technologies and efficiency gains made by the marine ingredient sector.
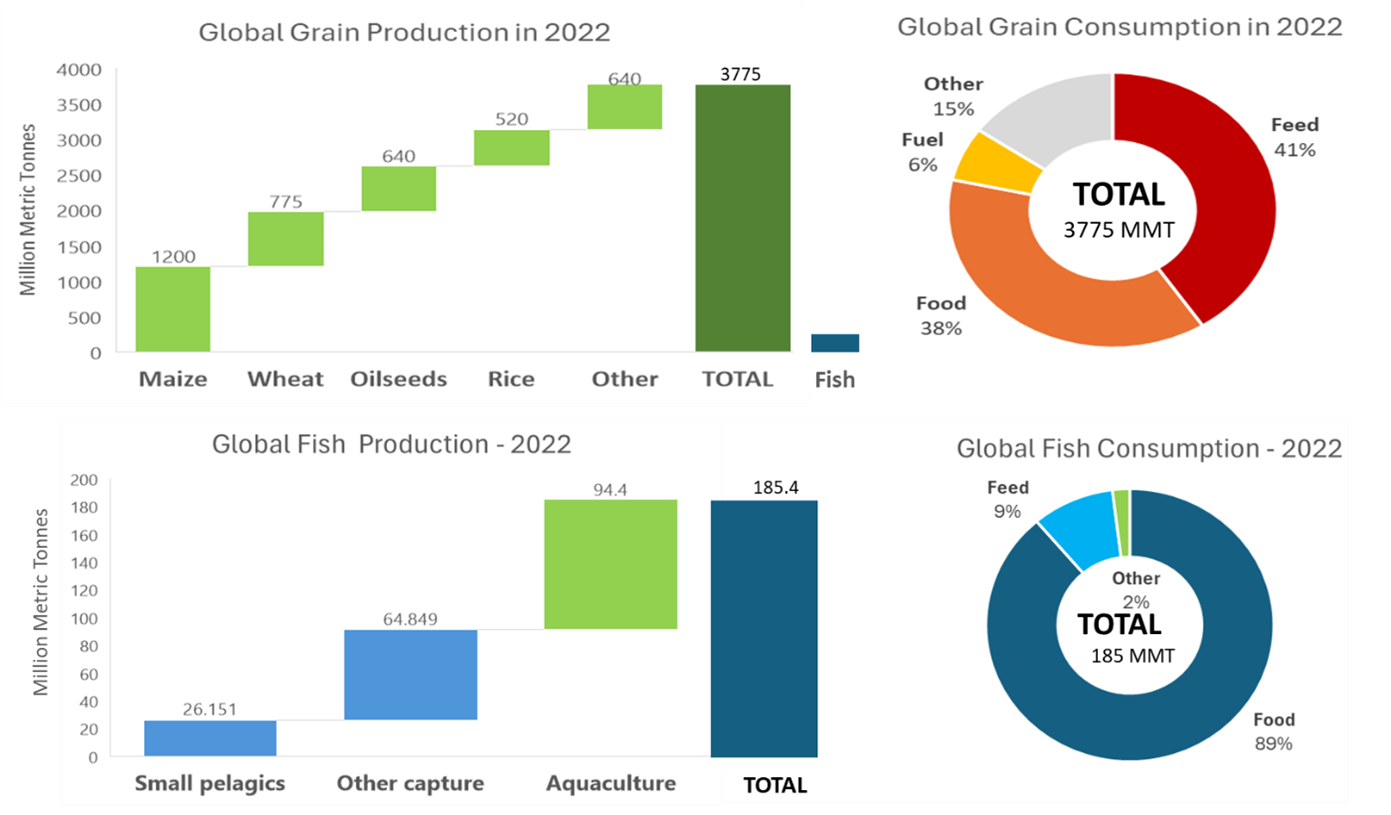
Figure 2. A breakdown of global grain and fish production by origin and consumption uses for 2022. Data Source: FAO (2024), “FAO Agricultural Outlook”, https://openknowledge.fao.org/items/5fcb6945-0669-4e99-a0f2-f756b503a5d3.
We need a system that compares across ingredients
The path to improving the sustainability of the marine ingredients sector is well known to the sector. While metrics like FIFO, FFDR or eFIFO are arguably all improvements on their predecessor, none of them addresses the issues of the alternative ingredients used to replace them nor, do they consider differences in the management of fisheries. It is well recognised that a well-managed fishery provides an important resource for global human nutrition. However, there is no clear sustainability basis for the direct or indirect use of nutrients for human nutrition. What is clear is the need for an objective comparison among all the various feed ingredient options available, so that when a choice needs to be made, the best outcome can be achieved. To achieve this, a system that allows direct comparisons of all ingredients based on shared sustainability criteria needs to be adopted and used. It is clear that the system to be used is that of life cycle assessment (LCA) analysis.
Life cycle assessment compares a range of environmental impacts assignable to products and services by objectively measuring all the inputs and outputs associated with various material and energy flows and using standardised attribution values (ISO 14040). Using LCA, it can be seen that impacts occur throughout value-chains, including from raw material extraction (capture), to processing, distribution, consumption and at the point of waste disposal. The methodology for using LCA is becoming increasingly standardised, with various phases included in undertaking such an assessment. At the initiation is a mapping exercise whereby the system boundaries in which the LCA analysis are considered are established. Following mapping of the various systems involved, and their connection points (gates), the LCA process progresses by the compilation of a life cycle inventory (LCI) of the relevant energy and material inputs and environmental releases that occur within each system boundary, The establishment of the LCI then allows an evaluation of the potential environmental impacts associated with each of the identified inputs and releases, and in the process allows the identification of “hotspots”, or points in the lifecycle where parameters are most environmentally sensitive.
An important aspect to the LCA story, is that it is not constrained to just carbon footprint, which is perhaps the best-known impact category. LCA actually allows for up to 18 different environmental impacts to be assessed (Figure 3). In addition, each of these impact categories aligns well with the United Nations Sustainable Development Goals (SDG). More impact categories are being developed each year, with new ones that cover socio-economic as well as environmental impacts being developed. How you plan and execute the data collection in LCA can have important effects on the interpretation. Because of these constraints, there have been various standards set on LCA, including the International Standardisation Organisation (ISO) ISO 14040 series, the European Union Product Environmental Footprint Categorisation Rules (PEFCR) approach and more recently the Global Feed Life Cyle-Assessment Institute (GFLI) being established as an independent repository with an available databases and tools.
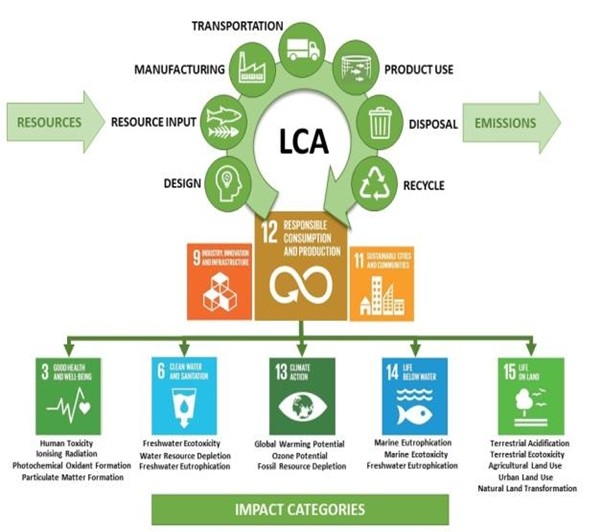
Figure 3. Stages in the design of an LCA analysis and the alignment of the various impact categories with the United Nations Sustainable Development Goals (SDG).
With LCA as a more widely applied sustainability tool, it can be seen that all ingredients have sustainability impacts of biodiversity loss, carbon emissions, and resource use. One of the often-overlooked contentions with the use of agricultural commodities is the occurrence of widespread deforestation. This has clear implications for depletion of biodiversity and massive amounts of carbon-release each year, that are typically associated with recent land clearing (Hilborn et al., 2023). However, no cropping system anywhere can isolate themselves completely from such clearing as it is just a matter of when it occurred, not if. Additionally, the production of the crops themselves each year produces enormous amounts of soil loss and carbon emissions from the fuel used. Beyond these, the widespread use of insecticides and herbicides further contributes to a host of other ecological threats. Arguably no agricultural cropping system anywhere can be insulated from issues of land clearing and biodiversity loss. A comparison of a suite of ingredients typically used in European salmon feeds clearly shows the extent of such a footprint (Figure 4).
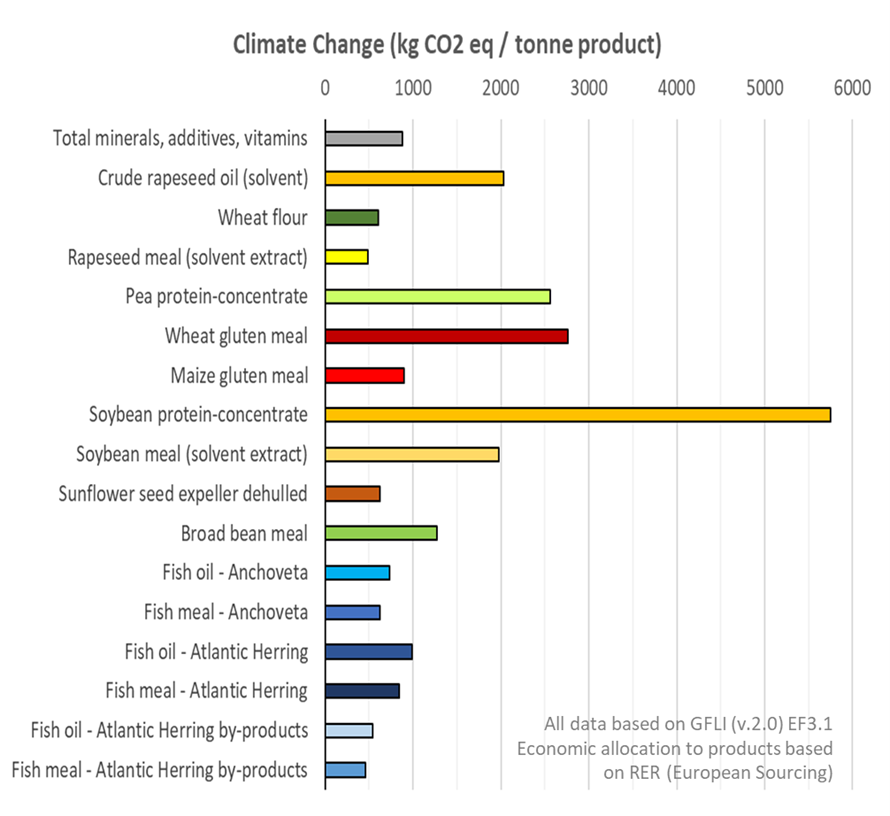
Figure 4. The climate change potential (carbon footprint) of an assortment of feed ingredients commonly applied to European salmon feeds. All data based on GFLI (v.2.0) EF3.1 Economic allocation to products based on RER (European Sourcing). Original data sourced from GFLI (v2.0) database.
Enabling effective comparisons
Seafood is essential to feed the world’s growing population but must be managed sustainably. It remains the world’s most traded food and largest supply of animal protein. Resources from seafood provide important nutrition to the global human population, and this can be delivered either through direct consumption or indirectly through animal feeds. Indirect application allows the use of marine resources which may be neither palatable nor available to many, to be converted into food that is highly nutritious, highly valued and widely traded to ensure its nutritional qualities are spread throughout the world. It also allows for resources which are often available in large quantities in short periods of time to be stabilized and then used in a more targeted way and over a longer period (Glencross et al., 2024b). Thus, it can be seen that marine ingredients, when considered in a global nutrition context, clearly increase the overall availability of seafood through their underpinning use in aquaculture. However, it remains important to ensure that aquaculture feeds develop sustainably, whilst accounting for their use of all ingredients, and accounting for the broader environmental impacts of production. The sustainability story needs to be considered in context of its role in the broader feed system, not in isolation. Otherwise, we are likely to make trade-offs that will potentially result in bigger sustainability issues and/or increase feed-system risk. Neither of which is acceptable to global food security. The most robust way to assess the sustainability of marine ingredients is based on LCA. As a way of improving our decision making it presents clear opportunities for the comparison of different resources based on specific sustainability impact categories. This is something that adds considerable sense to the sustainability story and needs to be more broadly adopted and embraced across the feed ingredient sector.
Declaration of Interest Statement
BG has both a university affiliation and a commercial affiliation with a member-based organisation representing the international marine ingredient sector.
References
Boyd CE, D'Abramo LR, Glencross BD, Huyben DC, Juarez LM, Lockwood GS, McNevin AA, Tacon AG, Teletchea F, et al. 2020. Achieving sustainable aquaculture: Historical and current perspectives and future needs and challenges. Journal of the World Aquaculture Society. 51(3): 578-633.
Calder PC, 2015. Functional roles of fatty acids and their effects on human health. Journal of parenteral and enteral nutrition, 39, 18S-32S.
Food and Agricultural Organisation (FAO) 2022. State of the World's Fisheries and Aquaculture’ (SOFIA), Food and Agricultural Organisation, Rome, Italy. pp 266.
Free CM, Jensen OP, Hilborn R. 2021. Evaluating impacts of forage fish abundance on marine predators. Conservation Biology. 35(5): 1540-1551.
Glencross B, Fracalossi DM, Hua K, Izquierdo M, Mai K, Øverland M, Robb D, Roubach R, Schrama J, Small B, et al. 2023. Harvesting the benefits of nutritional research to address global challenges in the 21st century. Journal of the World Aquaculture Society. 54(2): 343-63.
Glencross BD, Bachis E, Robb D, Newton R., 2024a. The Evolution of Sustainability Metrics for the Marine Ingredient Sector: Moving Towards Holistic Assessments of Aquaculture Feed. Reviews in Fisheries Science & Aquaculture, 32(4), 545–561. https://doi.org/10.1080/23308249.2024.2337426
Glencross B, Ling X, Gatlin D, Kaushik S, Øverland M, Newton R, Valente LMP, 2024. A SWOT Analysis of the Use of Marine, Grain, Terrestrial-Animal and Novel Protein Ingredients in Aquaculture Feeds. Reviews in Fisheries Science & Aquaculture, 32(3), 396–434. https://doi.org/10.1080/23308249.2024.2315049.
Hilborn R, Amoroso RO, Anderson CM, Baum JK, Branch TA, Costello C, de Moor CL, Faraj A, Hively D, Jensen OP, et al. 2020. Effective fisheries management instrumental in improving fish stock status. Proceedings of the National Academy of Sciences. 117(4): 2218-2224.
Hilborn R, Buratti CC, Diaz Acuna E, Hively D, Kolding J, Kurota H, Baker N, Mace PM, de Moor CL, Muko S, et al. 2022. Recent trends in abundance and fishing pressure of agency‐assessed small pelagic fish stocks. Fish and Fisheries. 23(6): 1313-1331.
Hilborn, R., Amoroso, R., Collie, J., Hiddink, J. G., Kaiser, M. J., Mazor, T., ... & Suuronen, P. (2023). Evaluating the sustainability and environmental impacts of trawling compared to other food production systems. ICES Journal of Marine Science, 80(6), 1567-1579.
IFFO. 2024. https://www.iffo.com/key-facts. Accessed 2024.03.25.
Jackson A. 2009. Fish in–fish out ratios explained. Aquaculture Europe. 34(3): 5-10.
Kaushik SJ, Troell M. 2010. Taking the fish-in fish-out ratio a step further. Aquaculture. 35(1): 15-17.
Kok B, Malcorps W, Tlusty MF, Eltholth MM, Auchterlonie NA, Little DC, Harmsen R, Newton RW, Davies SJ. 2020. Fish as feed: Using economic allocation to quantify the Fish In: Fish Out ratio of major fed aquaculture species. Aquaculture. 528: 735474.
Naylor RL, Goldburg RJ, Primavera JH, Kautsky N, Beveridge MC, Clay J, Folke C, Lubchenco J, Mooney H, Troell M. 2000. Effect of aquaculture on world fish supplies. Nature. 405(6790): 1017-1024.
Naylor RL, Hardy RW, Buschmann AH, Bush SR, Cao L, Klinger DH, Little DC, Lubchenco J, Shumway SE, Troell M. 2021. A 20-year retrospective review of global aquaculture. Nature. 591(7851): 551-563.
Tacon AGJ, Metian M. 2009. Fishing for aquaculture: non-food use of small pelagic forage fish—a global perspective. Reviews in Fisheries Science. 17(3): 305-317.