This piece was published in the September 2022 edition of International Aquafeed Magazine
Author: Brett D. Glencross
While aquaculture appears as one of the better sustainability options in terms of global animal production, the sustainability of the feeds used in the sector appears to be maintaining its prominence in the media of late. Not surprising perhaps, as several studies have clearly indicated that more than 90% of the footprint in aquaculture is linked to feed use.
So, it was interesting to come across a recent article that reported on some of the efforts of the big salmon feed companies to address their carbon-footprints. Both BioMar and Skretting mentioned about using innovative approaches to address this challenge. BioMar clearly indicated that through addressing one perceived issue of marine resource use, its feeds were pushed into a direction that increased its carbon-footprint. So, it was interesting to read that they saw their future direction as one of circularity and avoiding products that had direct-human-consumption (DHC) potential, with the use of things like novel single-cell protein sources. Skretting on the other hand were comparatively clandestine in their response, stating that “they know their hotspots are linked to plant-proteins,... and are working on a plan to help achieve reductions”, but did not elaborate much further.
In reading the various responses, it made me think about what a comparative lifecycle assessment (LCA) approach for comparing different aquaculture feeds might actually look like against each other and against something like a poultry or pig feed. At least in terms of the raw material usage. The great thing about using such an LCA approach to assessing the sustainability of an ingredient, is that it provides a clear point of objectivity to the process, something that unfortunately seems all too absent in much of the sustainability story. Additionally, with access to resources like that of the Global Feed Lifecycle Assessment Institute (GFLI) database, it becomes a relatively straight-forward feed formulation exercise, with just the need for the inclusion of some additional parameters. So, with that in mind, I updated my formulation database to include global warming potential (GWP), otherwise known as carbon-footprint, using the GFLI data, and went about formulating a series of aquaculture, poultry, and pig-feeds (Figure 1).
Now there are various caveats to such an exercise, but what I observed was that a standard salmon grower diet (formulated as a 34% digestible protein and 20 MJ digestible energy) has a GWP (carbon-footprint) of around 2,250 kg CO2-equivalent per tonne of feed. As far as the range of formulations I explored went, the Salmon STD diet* was quite high compared to those of a standard shrimp, pig, or chicken formulations. Though we need to be mindful here that the pig and chicken feed conversions are treble and double that of salmon respectively. Indeed, pig and poultry formulations were remarkably low in their footprints, driven mostly by the low footprint of wheat in these examples. But the exercise also showed that we could build in constraints to force that carbon-footprint lower. In fact, it was not that difficult, nor that costly to reduce the carbon footprint from 2,250 kg CO2-equivalent per tonne down to 1,600 kg CO2-equivalent per tonne of feed. This constraint only increased the formulation cost by $53 per tonne, or 3.2% of the Salmon STD cost. The other notable observation from that exercise was the change in raw material use as I went from a high to low carbon footprint. Here it could be clearly seen that there was a push to reduce plant-proteins and increase marine ingredients, with a notable drive to include the by-product fishmeals.
So, all this, to my mind at least, raises a clear question; what really constitutes a sustainable ingredient? Clearly carbon-footprint is only one such dimension in that story, but it is quite a prominent one in the 21st century, and one that is only likely to increase in prominence.
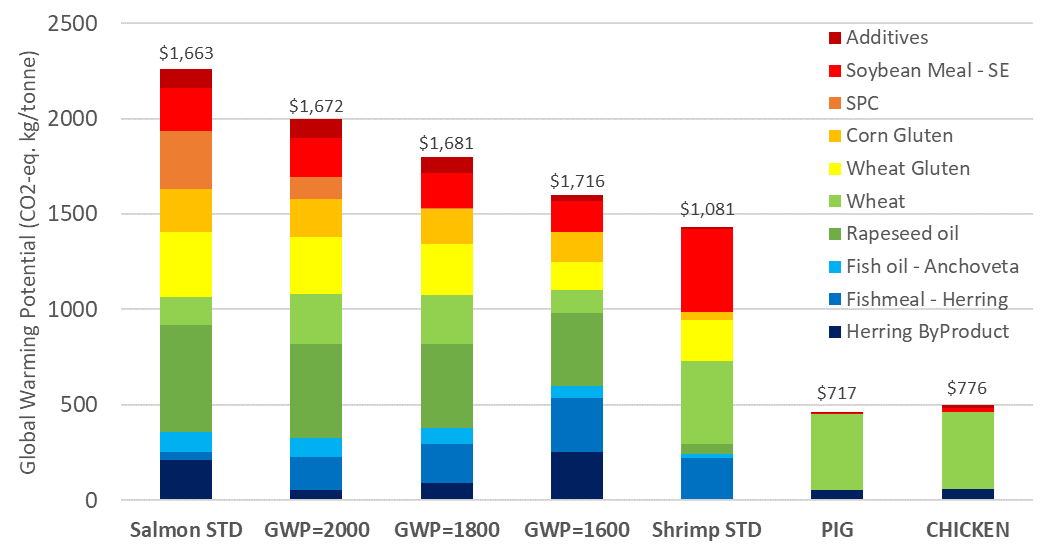
Figure 1. Global warming potential of different diets formulated using the same raw material “basket” with the formulation cost (USD) shown above and the formulation profile of each shown as the different colors (*Salmon STD: a standard European formulation for a 40Pro (34 DPro):30Lip (20 MJ DE) salmon grower diet; GWP=2000: same salmon formulation, but with GWP constrained to 2000 kg/tonne CO2-eq; GWP=1800: same salmon formulation, but with GWP constrained to 1800 kg/tonne CO2-eq; GWP=1600: same salmon formulation, but with GWP constrained to 1600 kg/tonne CO2-eq; Shrimp STD a standard SEAsian shrimp formulation for a 40Pro:8Lip diet; PIG: A standard pig grower formulation; CHICKEN: A standard chicken grower formulation). All data from diets formulated based on GFLI ReCiPe Economic allocation to products based on RER (European Sourcing) or GLO (Global Sourcing) values, except Herring By-Product meal which uses data from Dr Richard Newton, University of Stirling.